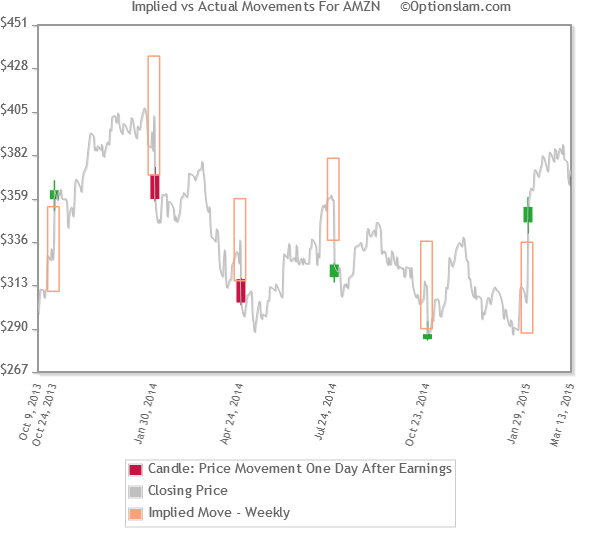
I=Inside Move: Underlying Stock moved less than the pre-Earnings release Implied Move.
O=Outside Move: Underlying Stock moved more than the pre-Earnings release Implied Move.
By default we display 10 most recent earnings and calculate mean and median of past 10 earnings.
Insider members can adjust the following settings across all sites:
Options pricing gives an indication of what the market expects in stock price range as a result of
upcoming earnings announcement.
With little time remaining to a weekly options expiration, only a small percentage of the extrinsic value can be attributed to true time value.
Therefore, the larger portion of extrinsic value must be associated directly to the markets expectation of the underlying's price range upon the announcement.
At Optionslam, we do of the ATM straddle/strangle to get a handle on what the market thinks the Implied Move will be before and after the earnings.
We also show a history of previous earnings events with the pertinent data highlighting the implied move compared to actual one day move statistics.
Implied Movement: Weekly Straddle Tracking History
At OptionSlam.com we make a concerted effort to provide the most accurate Earnings Calendar available by cross checking various sources including newswire feeds, brokerages, exchanges and individual corporate investor relations websites.
Despite our diligent efforts, OptionSlam.com cannot guarantee the accuracy of any earnings date. A wide variety of events can alter scheduled Earnings Release dates.
Because estimated dates come from a variety of sources it is possible for an estimated date to be outside the OptionSlam projected window.
It is up to each trader to verify any data found on our web site and assume all risks associated with using said data.
NextEra Energy (NEE)
- NYSE
Next Earnings Date:
Estimated on Oct. 27, 2026
OS Projected Window: Oct. 19, 2026 to Oct. 24, 2026