|
Optionslam.com |
|
|
|
|
|||||||||||
| Log In | Join US | ||||||||||||
|
||||||||||||
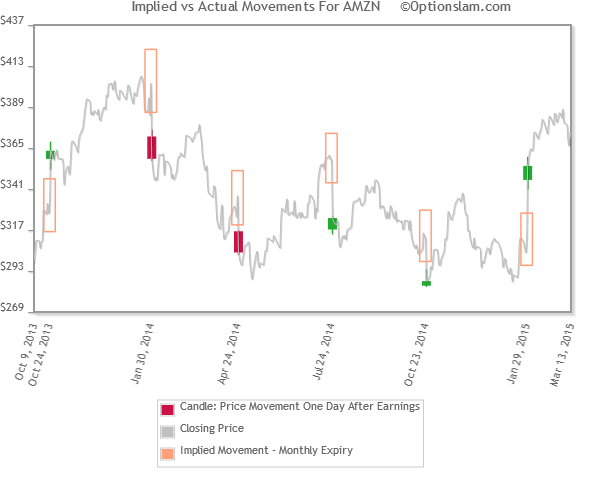
IMPLIED MOVE MONTHLYThe price of the ‘at the money’ (ATM) straddle is a market generated indication of the price change expectation in the underlying stock between now and the regular monthly options expiration day. In the case of a stock that has an earnings date prior to expiration day much of that implied move (IM) is due to the earnings release (ER) and is often realized the trading day after the ER.
Chart Description Though simple in appearance the chart above reveals a wealth of information. It begins with a simple line chart indicating price of the underlying stock. The market is anticipating a move X% above or below where the stock was trading on that day. The hollow vertically oriented peach colored rectangle identifies the IM on the trading day prior to the ER. The red or green colored Japanese style candle represents actual price movement (ohlc) of the underlying stock one trading day post ER. Armed with this information the trader is well equipped to design trading strategy based on actual historical behavior. Important Note: Using monthly straddle pricing to develop IM data tends to overstate the IM especially when there is more than ten days to the regular monthly option expiration date. We do provide the Implied Move Weekly page for a more accurate implied move for stocks which offer weekly options. Please refer to the Implied Move Weekly page when available for your stock. |
About Us | Site Map | Strategy Testing | Disclaimer | Contact Us | Copyright © 2003-2026 Optionslam.com LLC, All Rights Reserved. (AWS10t) |
||
 Site Help
|
Site Help
|