|
Optionslam.com |
|
|
|
|
|||||||||||
| Log In | Join US | ||||||||||||
|
||||||||||||
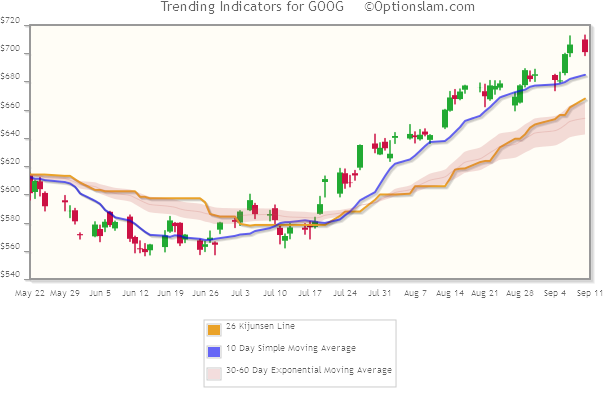
Topic: Optionslam.com Trending ChartIndicators: Blue Line: This is the 10 day simple moving average of stock closing price. Orange Line: This is the 26 day Kijunsen Line. This is taken from Ichimoku indicator. It is the 50% fibonacci line between highest high and lowest low within the period. Pink Area: This is the area bounded by 30 day Exponential moving average and 60 day Exponential moving average. Trending Definition: We define a stock as trending when its price direction agree with 10 day moving average and 26 day Kijunsen line. Blow is an example of upward trend line,
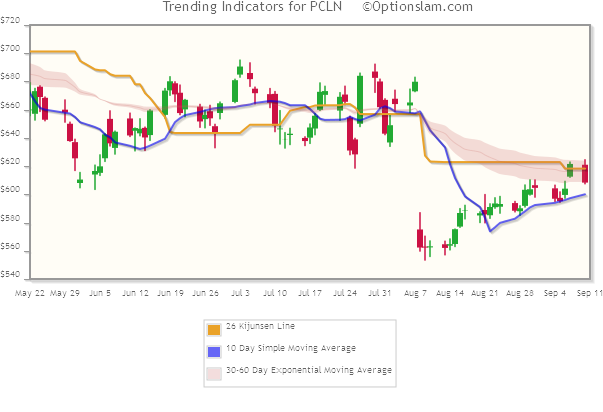
Consolidate Definition: We define a stock as consolidating when its price crosses 10 day moving average and 26 day Kijunsen line back and force. Below is an example of consolation pattern before the earnings,
|
About Us | Site Map | Strategy Testing | Disclaimer | Contact Us | Copyright © 2003-2026 Optionslam.com LLC, All Rights Reserved. (AWS10t) |
||
 Site Help
|
Site Help
|