Topic: Optionslam.com Weekly Options Chart
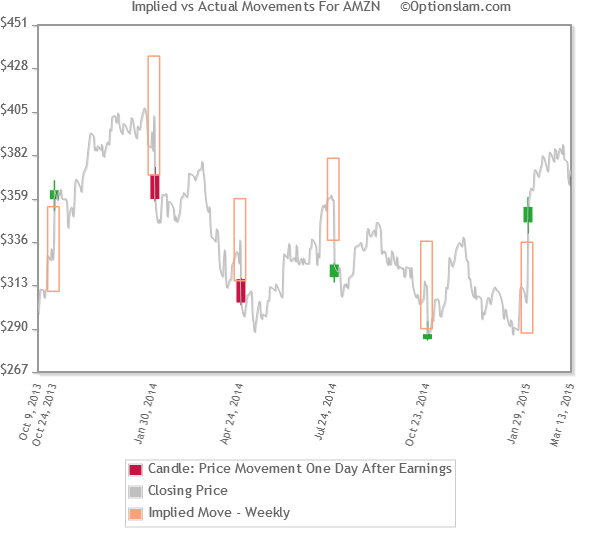
With this chart the trader can see a comparison of the pre-earnings Implied Move vs. the actual one day final price move of the underlying stock.
The candle represents the OHLC of the ATM straddle in the days approaching the earnings announcement.
The yellow bar designates the difference in stock price from the pre-earnings close to the one day post earnings closing price. The bar is represented as a percentage of the pre-earnings stock price regardless of whether the move was up or down.
 Site Help
|
Site Help
|