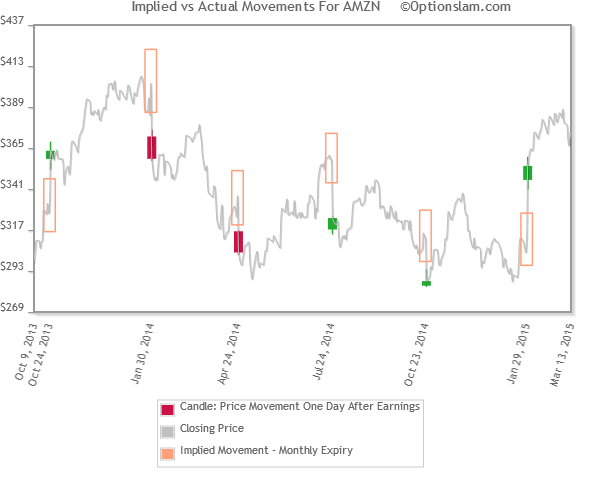
One Day Post Earnings Implied vs Actual Move
I=Inside Move: Underlying Stock moved less than the pre-Earnings release Implied Move.
O=Outside Move: Underlying Stock moved more than the pre-Earnings release Implied Move.
By default we display 10 most recent earnings and calculate mean and median of past 10 earnings.
Insider members can adjust the following settings across all sites:
At OptionSlam.com we make a concerted effort to provide the most accurate Earnings Calendar available by cross checking various sources including newswire feeds, brokerages, exchanges and individual corporate investor relations websites.
Despite our diligent efforts, OptionSlam.com cannot guarantee the accuracy of any earnings date. A wide variety of events can alter scheduled Earnings Release dates.
Because estimated dates come from a variety of sources it is possible for an estimated date to be outside the OptionSlam projected window.
It is up to each trader to verify any data found on our web site and assume all risks associated with using said data.