|
Optionslam.com |
|
|
|
|
|||||||||||
| Log In | Join US | ||||||||||||
|
||||||||||||
IMPLIED MOVE SEVEN DAYFound exclusively at OptionSlam.com are the seven day implied move charts and historical tables. Our unique formula produces the price of a theoretical at the money straddle which expires seven days out in time thereby indicating a market generated seven day implied move. Implied Move calculations are critical pieces of information which option traders use to assist in strategy design. The IM7 charts and tables are especially helpful for the trader looking to design a short term trade strategy around an earnings event.
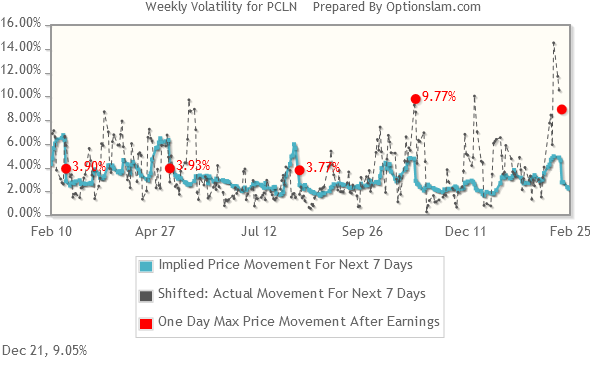
CHART DESCRIPTION The blue line on the chart is the theoretical seven day implied move. It is easy to see that implied volatility is building into an earnings event and crushing immediately thereafter by observing the IM7. Then for comparison purposes the actual maximum move over the next seven days is plotted by the black line Finally the actual one day post earnings max move is plotted with the red dot. All data on these charts is in absolute terms.
INTERACTIVE FEATURES Use the tabs just above the chart to choose between a one month or one year chart. Choose which plots to display by clicking on the available items in the legend just below the chart. To zoom into a specific area of the chart left click and hold dragging to frame the desired portion of the chart. Click the Reset Zoom button to return to the original chart. For specific data hover your mouse over any of the plots on the chart to see a pop up with the exact percentage represented.
TABLE The table at the bottom of the page provides all the statistical data which is represented in the charts above and more. The column headings are self-explanatory. |
About Us | Site Map | Strategy Testing | Disclaimer | Contact Us | Copyright © 2003-2025 Optionslam.com LLC, All Rights Reserved. (AWS10t) |
||
 Site Help
|
Site Help
|