|
Optionslam.com |
|
|
|
|
|||||||||||
| Log In | Join US | ||||||||||||
|
||||||||||||
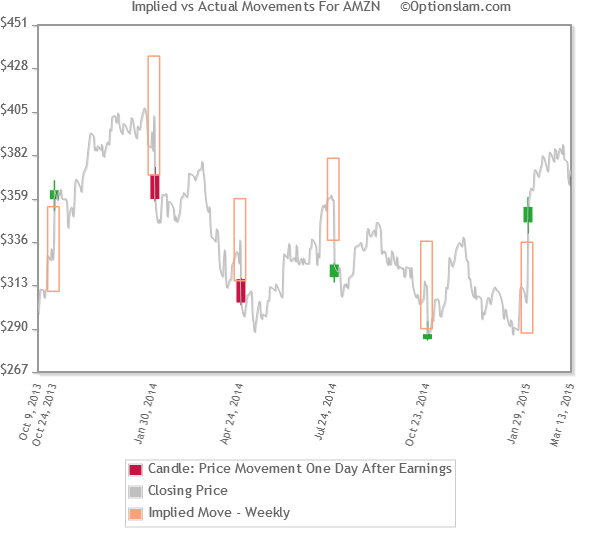
IMPLIED MOVE WEEKLYThe price of the ‘at the money’ (ATM) straddle is a market generated indication of the price change expectation in the underlying stock between now and the weekly options expiration day. We use the weekly option series which will expire the same week in which a stock has an earnings release (ER). In the case of a stock that has an earnings date prior to expiration day much of that implied move (IM) is due to the ER and is often realized the trading day after the ER.
Chart Description Though simple in appearance the chart above reveals a wealth of information. It begins with a simple line chart indicating price of the underlying stock. The market is anticipating a move X% above or below where the stock was trading on that day. The hollow vertically oriented peach colored rectangle identifies the IM on the trading day prior to the ER. The red or green colored Japanese style candle represents actual price movement (ohlc) of the underlying stock one trading day post ER. Armed with this information the trader is well equipped to design trading strategy based on actual historical behavior.
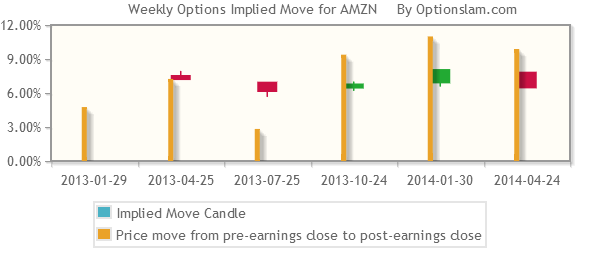
With this chart the trader can see a comparison of the pre-earnings Implied Move vs. the actual one day final price move of the underlying stock. The candle represents the OHLC of the ATM straddle in the days approaching the earnings announcement. The yellow bar designates the difference in stock price from the pre-earnings close to the one day post earnings closing price. The bar is represented as a percentage of the pre-earnings stock price regardless of whether the move was up or down. |
About Us | Site Map | Strategy Testing | Disclaimer | Contact Us | Copyright © 2003-2024 Optionslam.com LLC, All Rights Reserved. (AWS10t) |
||
 Site Help
|
Site Help
|