|
Optionslam.com |
|
|
|
|
|||||||||||
| Log In | Join US | ||||||||||||
|
||||||||||||
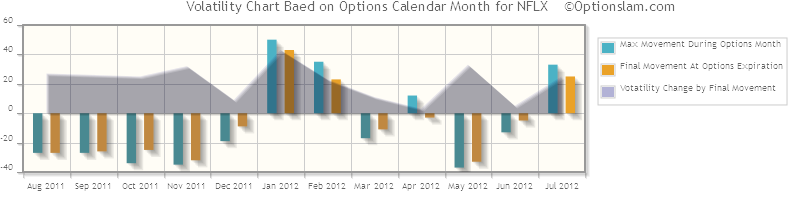
Topic: Optionslam.com Options Volatility ChartBlue Bar: This is the maximum price movement from the opening price on Options month start date to the highest high or lowest low during the options month. Yellow Bar: This is the final price movement from the opening price on Options month start date to the closing price on Options month expire date. Grey Shadow: Shadow size is the absolute value of the final price movement of each Options month. This shadow trend line presents the volatility change for last 12 months.
|
About Us | Site Map | Strategy Testing | Disclaimer | Contact Us | Copyright © 2003-2026 Optionslam.com LLC, All Rights Reserved. (AWS10t) |
||
 Site Help
|
Site Help
|